What I set out to build
The question was not just “what does the data look like?” It was how visitor patterns, attractions, geography, and available tourism information could support a useful strategy for Cochrane.
My contribution
- Cleaned and explored tourism/visitor data.
- Compared patterns across the available sources.
- Built visualisations to make the findings easier to interpret.
- Connected analysis to strategy recommendations.
Problem & approach
I worked through the available tourism data, compared patterns, created visualisations, and tried to connect the analysis to recommendations rather than stopping at charts. This project was more about reasoning from imperfect real-world data than building a software system.
How it works
- 01
Prepare data
Collect and clean the available tourism data.
- 02
Compare patterns
Compare visitor and attraction patterns.
- 03
Visualise
Visualise the most relevant differences.
- 04
Recommend
Translate those findings into a small set of recommendations.
Data & evaluation
Data & inputs
Tourist-device observations and visitor-category affinities in the linked case report.
Results & progress
- 136K+
- Tracked tourist devices
- $1.5–2.3M
- Estimated revenue opportunity
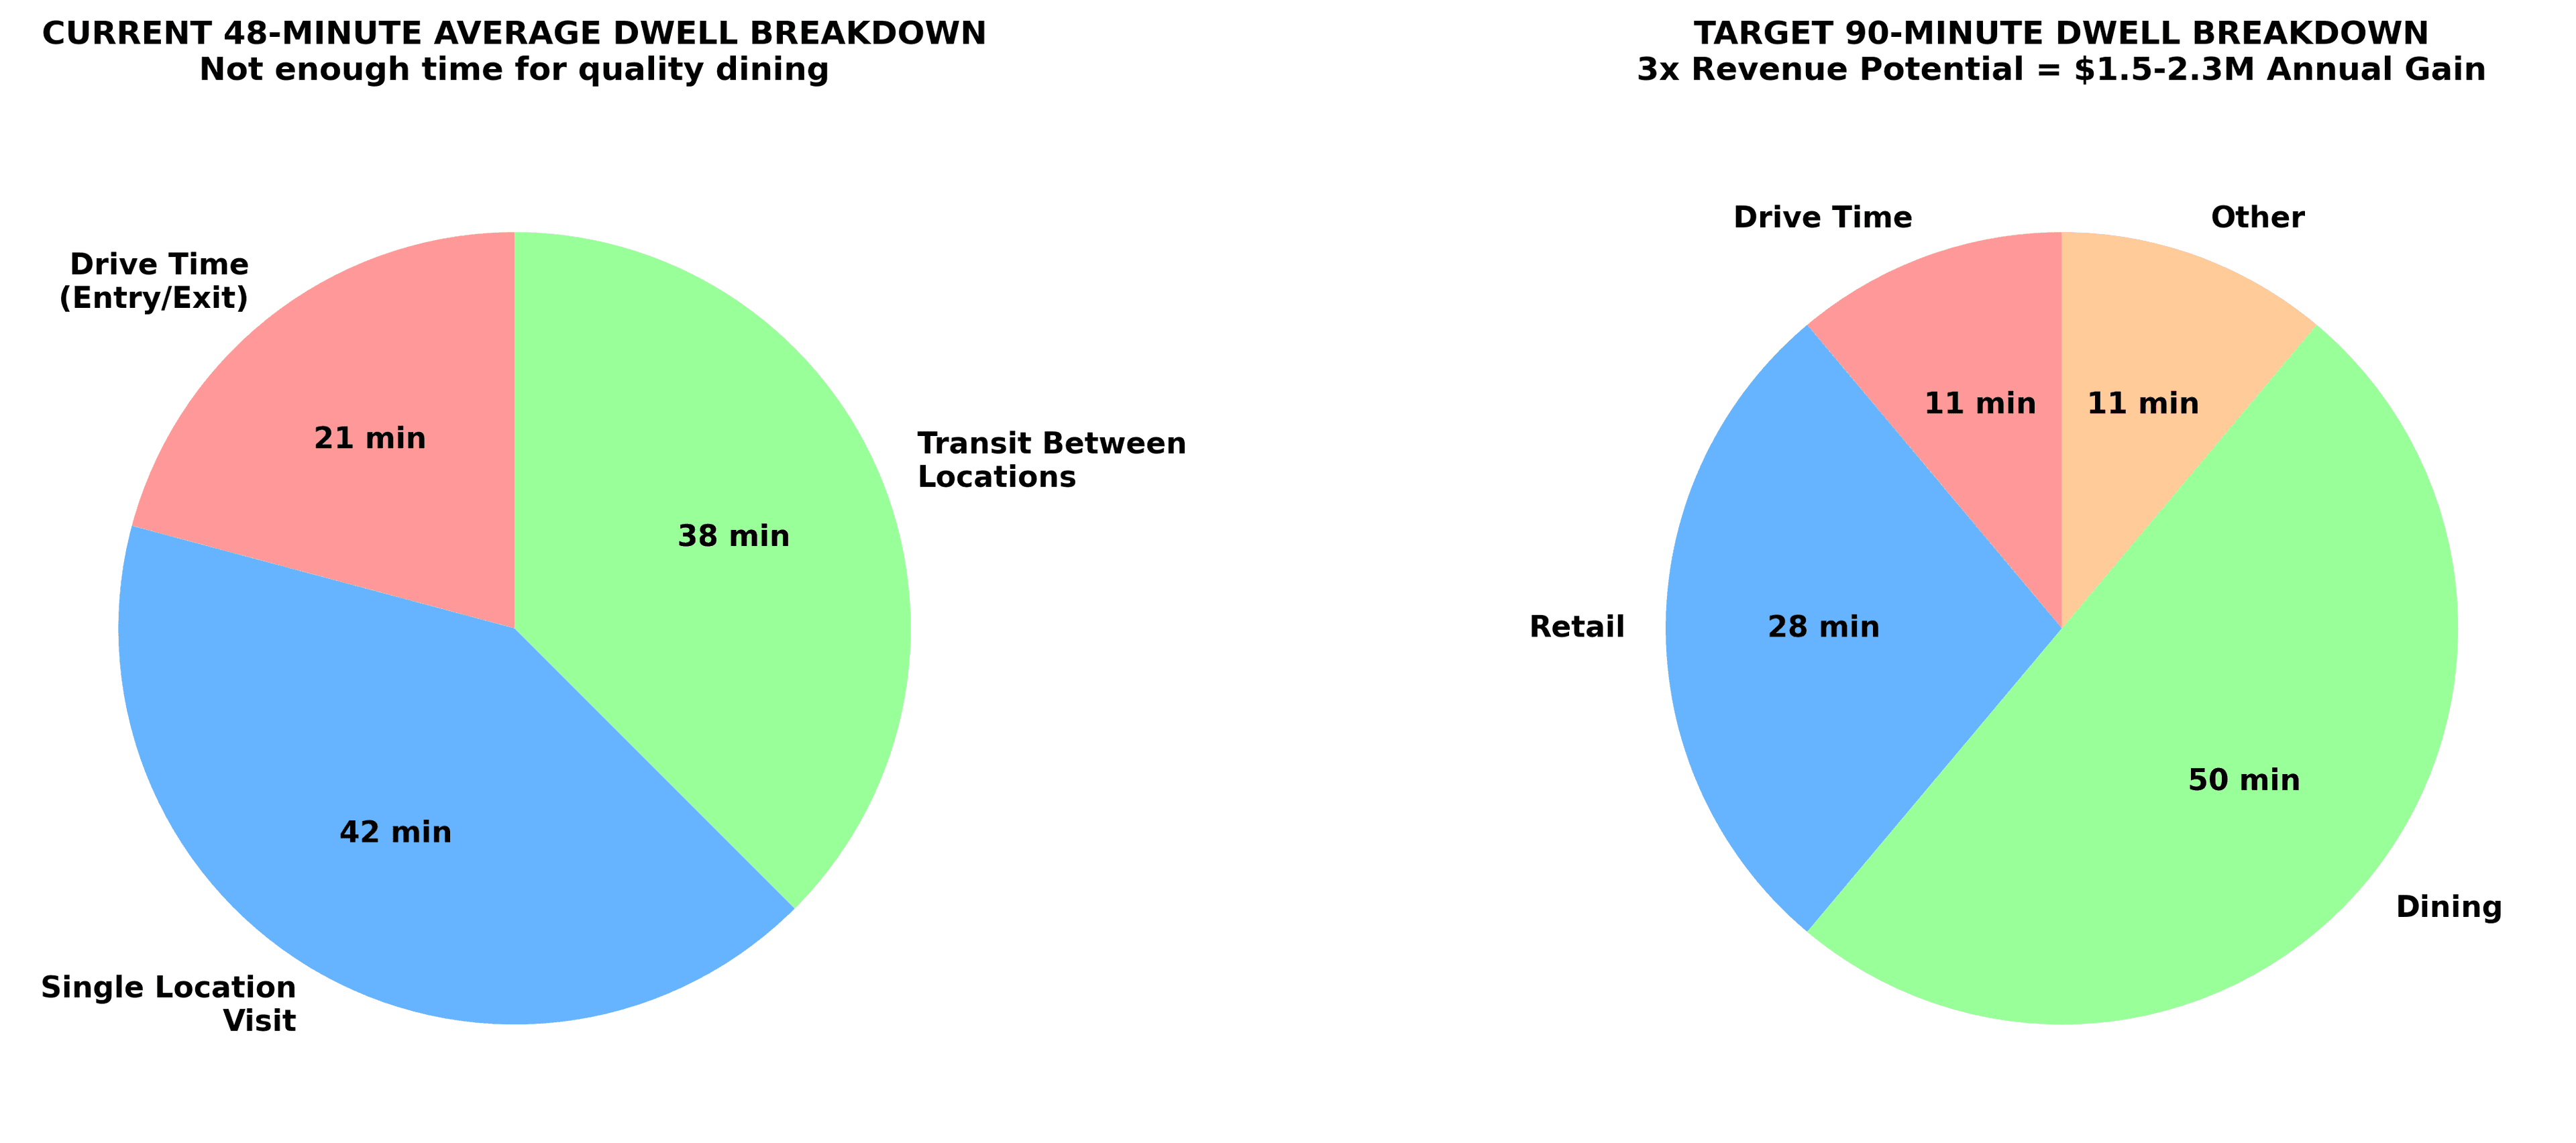
- 48 min
- Reported average visit
- Analysed visitor affinities and dwell time to distinguish stopping from staying.
- Produced a phased roadmap targeting visits of 90 minutes or more.
- The report estimates a $1.5–2.3M annual revenue opportunity under proposed scenarios. This is not revenue achieved.
Limits & lessons
Limitations
- The analysis depends on the quality and coverage of the available tourism data. Recommendations are analysis-backed suggestions without proven causal outcomes.
What I learned
- This project taught me that data work is only useful if it changes how someone thinks about a decision. A chart can be correct and still not answer the question the project actually cares about.
Next steps
- If I revisit the work, add clearer source notes and uncertainty around incomplete visitor data.